
The foreign exchange market is continuously changing and in order to keep up with these trends, traders need to use smart methods of forex trading. Traders these days utilize tools that help them predict future market directions, price movements, and behavior. Forex technical analysis is a widely used method in forex trading. It is an analysis of the past market data to make predictions about future market behavior. This technical analysis of market needs the use of different tools, Meta Trader4 indicators are such tool used for this purpose. Meta trader platform not just supports standard technical indicators but also custom indicators. Most of these MT4 indicators are free and users can easily share them. They are written in the MQL4 programming language.
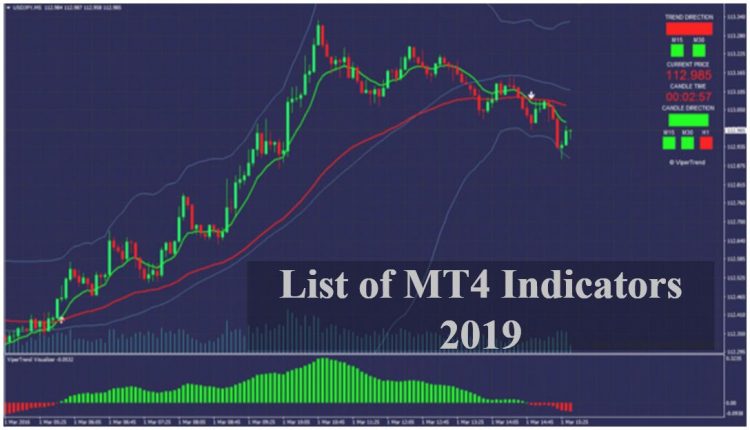
Have a look at some of the MT4 indicators forex traders use for 2019
Trigger SPL: Trigger SPL MT4 indicators automatically generate buy and sell signals by analyzing the current market trends. These signals help forex traders make the best decisions and earn huge profits. The key feature of the Trigger SPL indicator is the wait signal it generates. This wait signal is displayed when the market is experiencing a drift and there is no possible forecast. It prevents traders from making any bad decision during such times. These MT4 indicators filter false signals generated during the operation of the market.
There is another interesting feature in Trigger SPL, pivot points table. It is nothing but a pictorial representation of the trading sessions. Pivot tables help traders to predict support and resistance levels in current and upcoming stretch.
Trigger SPL software help brokers and traders to make a powerful judgment in manual trading. It can help you achieve 100% trading accuracy and huge profits. Trigger SPL works on all the time frames, traders choose the time frame according to their convenience. These indicators are very easy to understand, so it serves well for the beginner as well as experienced traders.
Moving Average Convergence indicator(MACD):
It is an MT4 indicator that shows the correlation between two moving averages of prices. MACD is the difference between a 26 period and 12-period Exponential Moving Average (EMA). To indicate buy and sell opportunities precisely, 9 period EMA of MACD which is called a signal line is plotted on the MACD chart. MACD indicators prove really effective in wide-swinging trading markets.
MACD is usually used in the following 3 ways: crossovers, overbought/ oversold conditions, and divergences.
Crossovers: when MACD falls below the signal line, it is best to sell. On the contrary, when MACD rises above the signal line, it is time to buy. All the forex traders check for crossover before making any trading decision.
Overbought/oversold conditions: when the MACD rises severely, it is called a dramatic rise. In such a situation, shorter moving average pulls away from the longer term MA, which indicates that the security is overbought and will return to normal levels.
Divergence: when the MACD diverges from the security, it is an indication that the current trend might be ending soon. A bullish divergence occurs when the MACD indicator is making new highs while prices fail to achieve new highs. A bearish divergence is when MACD is making new lows while prices fail to achieve new lows.
Money flow index:
MFI predicts the reliability of the trend by using price and volume of the instrument. MFI is also called as the volume weighted RSI. Relative Strength Index (RSI) is a momentum oscillator that calculates the speed and change in the price movements. Value of RSI oscillates between 0 to 100. For each period, MFI starts with a typical price. There are several steps involved in the Money flow index calculation. Expert traders recommend using 14day period for calculations.
You can calculate typical price using as follows:
(Low+ High+ Close)/3
Raw money flow:
Volume x Typical price
Money flow ratio:
(14-period Positive Money Flow)/ (14 periods Negative Money Flow)
Money Flow Index:
100-[100/(1+Money Flow Ratio)]
Raw money flow is positive when typical price from one period to next and negative when typical price decreases. When the typical price is unchanged, the raw money flow values are not used. Money flow ratio creates a base for the Money Flow Index.
Forex traders start hoping for good opportunities when MFI moves in the opposite direction of the price.
Leave a Reply